⮕ ① Integration of IoT in Smart Cycling Systems: How can Internet of Things (IoT) architecture be optimized to support real-time data collection and
analysis in wireless cycling systems? Students design a basic prototype or system model that integrates sensors (e.g., GPS, cadence, power meters) with a mobile app or cloud
database to demonstrate how real-time cycling data can be collected, transmitted, and visualized.
⮕ ② Data-Driven Decision Making in Cycling Performance: How can cyclists leverage data analytics
from electronic shifting and sensor systems to enhance training and performance? Students can analyze open-source or simulated cycling datasets to develop simple dashboards or
algorithms that provide actionable insights (e.g., optimal gear usage patterns, fatigue detection, or terrain-based shifting suggestions).
⮕ ③ User Experience (UX) and Interface Design in Smart Bike Systems: What are the key usability factors that influence the adoption of
integrated wireless communication systems in cycling? Conduct a UX study (e.g., surveys, interviews, or prototype testing) to assess how cyclists interact with digital interfaces (e.g.,
bike computers or apps) and suggest design improvements for better information delivery and decision-making during rides.
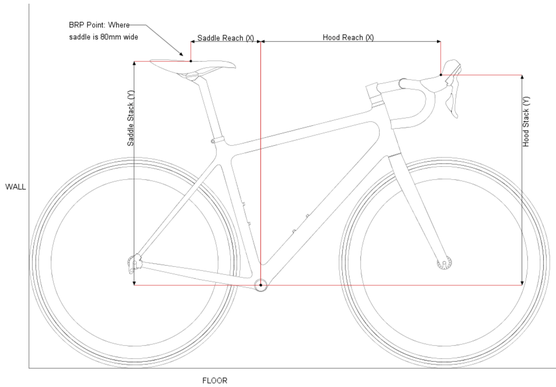
⮕ ① Real-Time Saddle Height Adjustment System Using Sensor Feedback: How can a real-time feedback system using wearable sensors be used to detect and
adjust improper saddle height during cycling? Students design a prototype system that collects joint angle and force distribution data using IMUs or pressure sensors, then gives
feedback (e.g., visual, haptic, or app-based) when the saddle height deviates from optimal parameters.
⮕ ② Analyzing Pedal Stroke Symmetry with Motion Capture and Data Visualization: How can motion
capture data be used to visualize and evaluate asymmetries in pedal stroke among novice versus experienced cyclists? Students use motion tracking tools to compare joint angles and
pedal efficiency across riders. Students create dashboards or animations to interpret and communicate findings from the captured movement data.
⮕ ③ Machine Learning Model to Predict Risk of Overuse Injury from Cycling Data: Can biomechanical sensor data be used to
build a predictive model for detecting early signs of overuse injury risk in cyclists? Students collect training data from sensor-equipped cyclists (e.g., knee tracking, force
distribution) and develop a simple machine learning classifier to flag movement patterns linked to injury risk.
⮕ ① Modeling Dead Zones in
the Pedal Stroke Using Sensor Data: How can real-time crank rotation data be used to detect and visualize torque dead zones during cycling? Students
can develop a system using crank angle sensors and torque measurement tools (or simulated data) to map torque output across the full pedal stroke. They can then build visualizations or models to
identify the top and bottom dead centers, quantify their duration, and suggest corrective adjustments (e.g., optimal crank arm length or cadence range).
⮕ ② Analyzing the Effect of
Freehub Engagement Speed on Pedal Lag: How does freehub engagement time affect power transfer responsiveness during cycling, and how can this be measured
using embedded systems? Students can build or simulate a test rig that tracks pedal input and rear wheel response using rotary encoders. Measure the delay (lag time) between input force
and wheel engagement across different hub models or conditions.
⮕ ③ Crank Length
Optimization Through Biomechanical and System Modeling: What is the relationship between crank arm length, cadence, and torque efficiency in cycling, and
how can it be optimized through simulation? Students can create a simulation (e.g., using MATLAB, Python, or Unity) to model crank biomechanics. The model would take rider parameters (leg
length, cadence preference, etc.) and simulate output torque and pedal stroke efficiency with different crank lengths. It could help personalize bike setup recommendations using data-driven
criteria.
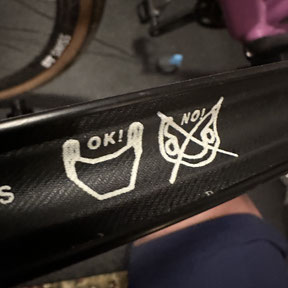
⮕ ① Tire Compatibility Verification System for Hookless Rims: How can a digital system be developed to verify tire compatibility with hookless rims based on real-time specifications and standards? Students can design a prototype
application or database-driven system that cross-references tire and rim models against international standards (e.g., ETRTO). The system could provide alerts for incompatible setups or recommend
optimal tire/rim combinations using rule-based logic or a simple matching algorithm.
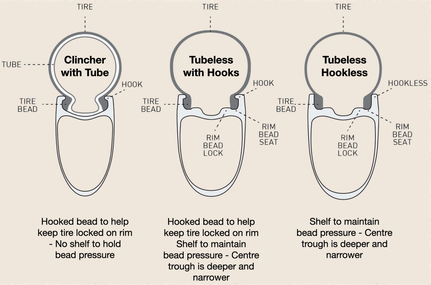
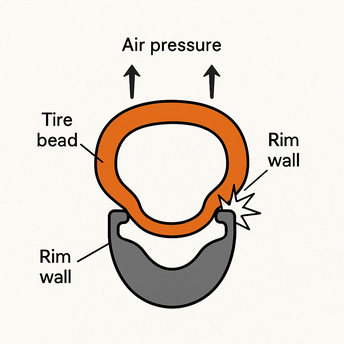
⮕ ② Simulation of Pressure Thresholds and Failure Risk in Hooked vs. Hookless
Rims: How can simulation models be used to analyze failure risks at different inflation pressures for hooked and hookless wheel systems? Students
develop a simulation (e.g., using MATLAB, Python, or a physics engine) to model tire pressure distribution and rim stress under various load scenarios. Outputs could include risk visualizations
of blowouts or failure points under improper configurations.
⮕ ③ Data-Driven Trade-Off Analysis Between Aerodynamics and Safety in Rim
Design: What are the measurable trade-offs between aerodynamic efficiency and safety in hooked versus hookless rim designs, and how can they be quantified
using sensor and performance data? Students collect or simulate data on drag coefficients, rim weight, and failure rates. Build a dashboard or decision-support tool that lets users explore
how prioritizing one factor (e.g., weight, pressure tolerance, or speed) affects overall system performance and safety in different scenarios.